Reporting: Response Cycle SLA Analysis – Status of Mailboxes
The Response Cycle SLA Analysis Status of Mailboxes report is designed to give you a clear sense of how your mailboxes are performing against response SLAs. Rather than focusing on individual activity, the report helps you understand mailbox health, spot pressure points, and decide where attention is needed.
It’s especially useful for day-to-day monitoring, team check-ins, and keeping ahead of potential SLA breaches.
Opening the Report
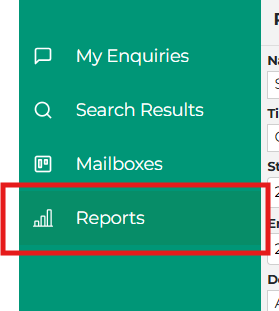
To access the report, log in to your account, go to Reports, and select Response Cycle SLA Analysis – Status of Mailboxes.
See screenshot below showing where to access the report.
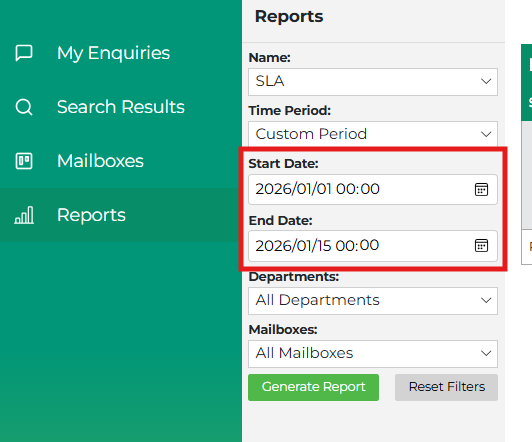
When the report opens, it automatically lands on a Month-to-Date view. This means you are always starting from the first day of the current month up to the end of the previous day. Starting from the same view each time makes it easier to compare results over time and keeps everyone aligned when discussing performance.
See screenshot below showing the default date range.
Reading the Report
Each row in the table represents a mailbox. As you scan down the report, you’ll start to get a feel for which mailboxes are under control and which ones may need attention.
The numbers you see reflect how that mailbox is performing against SLA, along with indicators that help you understand workload and response pressure. You don’t need to interpret every column at once, the report is designed so that problem areas naturally stand out as you read across a row.
Understanding Unactioned Work
When your selected date range includes today, the report shows unactioned responses. These are open enquiries that are still waiting for a response.
To make prioritisation easier, unactioned work is grouped in a way that shows what has already breached SLA, what is at risk of breaching today, and what still has time remaining. This allows you to quickly decide where effort should be focused first.
If your selected date range does not include today, these unactioned values are hidden. This keeps historical reporting clean and avoids mixing live operational data with past performance.
Oldest Open Enquiry
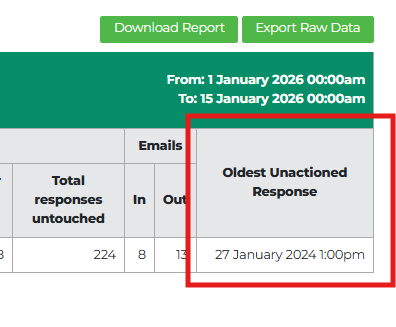
Alongside the unactioned figures, the report also shows the oldest open enquiry for each mailbox when viewing today’s data. This gives immediate visibility into work that may have been sitting unattended for the longest time and can help highlight backlogs or handover gaps.
If a mailbox has no open enquiries, this field will simply be blank.
See screenshot below showing the oldest unactioned enquiry.
Filtering the View
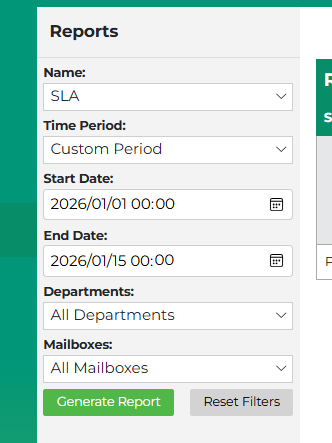
If you want to focus on a specific area, you can refine the report using the filters at the top. Selecting a department narrows the list of mailboxes, and you can choose one or more mailboxes to focus on. You can also adjust the date range if you want to look back at an earlier period.
As you change filters, you need to click “Generate Report”, the report refreshes to reflect your selection.
See screenshot below showing the filter section.
Downloading and Exporting
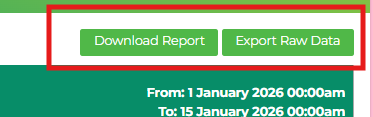
If you need to share what you’re seeing, the Download option lets you save a copy of the report exactly as it appears on screen. This is useful for quick sharing or offline reference and includes mailbox-level totals only.
Managers will also see an Export option. This provides a more detailed file that can be used for deeper analysis or follow-up discussions. Standard users won’t see this option, keeping the focus on team-level visibility.
See screenshot below showing the Download and Export options.
A Few Tips When Using This Report
Most users find this report works best as a regular check-in tool. Using the default view gives you a reliable snapshot, while the unactioned and oldest enquiry indicators help guide daily prioritisation. When something looks off, drilling in or exporting data can help support the next conversation.