Reporting: MIS Reports – Manager Guide
The MIS Report is there to help managers step back and look at enquiry activity across their mailboxes in a more structured way. Instead of focusing on individual cases, the report gives you a broader view of volumes, patterns, and how enquiries are being categorised over time.
It’s most useful when you want to understand trends, prepare regular reporting, or compare activity across teams or mailboxes.
Opening the Report
To access the MIS Report, log in, go to Reports, and select MIS Report.
See screenshot below showing where to access the MIS Report.

When the report opens, you’ll notice that everything you need is on one page. Filters, view options, and results all sit together, so you can adjust things as you go without restarting or navigating away.
See screenshot below showing the MIS Report layout.

Getting Started
When you first arrive on the MIS Report, you can either load a report you’ve saved before or start a new one. Loading a saved report is helpful if you run the same report regularly, as it automatically applies your usual filters and settings. Starting a new report is useful when you want to explore the data from a different angle.
See screenshot below:
Filtering the Data
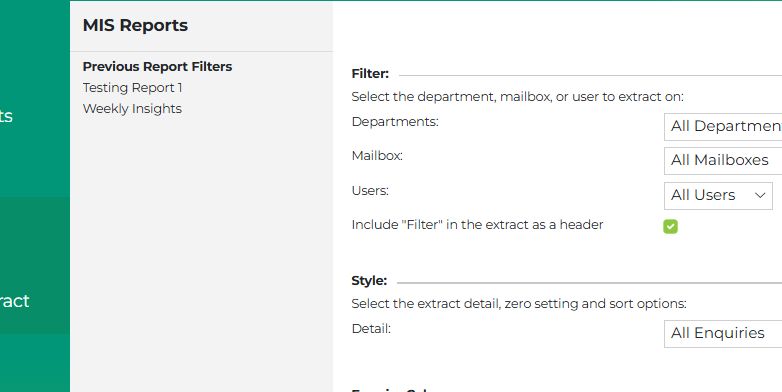
Before looking at the results, you’ll usually start by narrowing things down using the filters at the top of the page. You can filter by department, select one or more mailboxes, choose specific users, and define the date range you’re interested in.
As you make changes, the available options adjust automatically, which makes it easier to stay within the data that’s relevant to you.
See screenshot below showing the filter section.

Choosing How You Want to View the Data
The MIS Report lets you look at the data in two different ways, depending on the level of detail you need.
If you’re interested in understanding overall patterns and counts, the Summary Totals View gives you a high-level breakdown. In this view, you choose one main field for example, status, product type, or resolution, and the report shows you how many enquiries fall into each category. This is useful for spotting trends and understanding how enquiries are distributed.
See screenshot below showing the Summary Totals View.

If you need to look more closely at individual enquiries, the All Enquiries View shows one enquiry per row along with the related MIS information. This view is often used when you want to export data for further analysis or answer more detailed questions.
See screenshot below showing the All Enquiries View.

Adjusting What You See
In the All Enquiries View, you have control over which columns appear. You can select only the fields that matter to you, and the report will update to show just those columns. The same selection also applies when you export the data, so what you see on screen matches what you take out of the system.
See screenshot below showing the column selector.
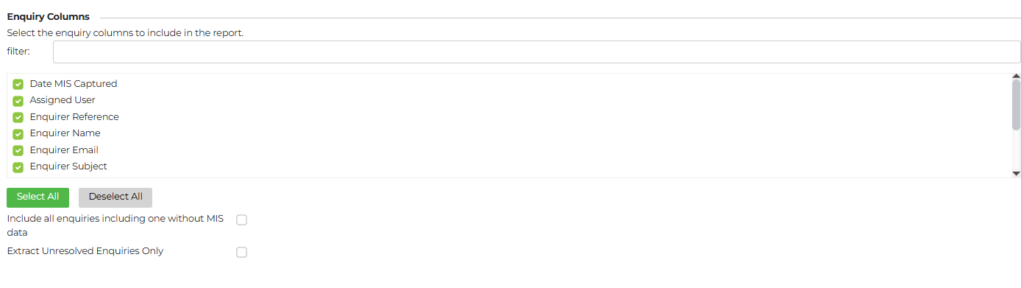
You can also choose whether to include enquiries that don’t have MIS data, or focus only on unresolved items, depending on what you’re trying to understand.
Working Across Multiple Mailboxes
When you select more than one mailbox, the MIS Report automatically adjusts to show only the information that makes sense across all selected mailboxes. If the mailboxes are structured differently, the report still runs and falls back to standard enquiry information so that you can always produce a result.
This makes it easier to compare activity across teams without needing to know how each mailbox is set up.
Saving Your Setup
Once you’ve set up a report in a way that works for you, you can save it with a name. This is especially helpful for recurring reports, such as monthly reviews or executive summaries, as it allows you to return to the same setup without reapplying filters each time.
See screenshot below showing how to save a report.

Exporting the Results
Both summary and detailed views can be exported to Excel. The exported file reflects exactly what you’ve configured on screen, including filters, columns, and the order of the data. This makes it easy to share insights or continue working with the data outside of our interface.
Using the MIS Report Day to Day
Most managers use the MIS Report as a way to check trends, support discussions, and prepare reporting rather than as a live operational tool. Spending a few minutes adjusting filters and switching views can often reveal patterns that aren’t obvious when looking at individual enquiries.